
Making an Interactive SVG London Tube Map with Raphael JS
The London Tube Map is a wonderful thing. Making it interactive makes it even more wonderful. The possibilities of what can be done with a fully interactive, SVG (well, RaphaelJS) driven tube map in terms of visualisations are endless. Given that TFL have also made a giant leap towards opening their data, which in itself has sewed the seeds from some pretty exciting projects already; combining the two could be a lot of fun.
Update: I have made a functional demo of this over here
Is there an easy way to convert this increasingly mammoth tube map into a clean, cross browser, interactive map?
The short answer is.... no, but here's how anyway.
Allow me to explain why. I'm sure someone will find this post and tell me straight away that I could've done this using a much simpler approach, but this is how I tackled it.
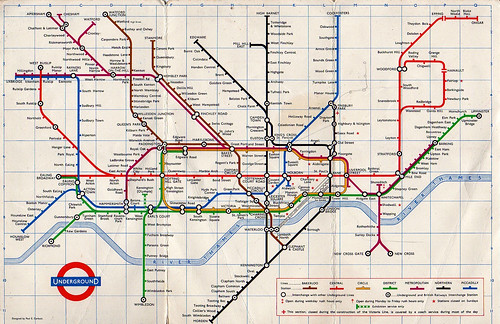
Firstly, get the right Tube Map
Ok, it sounds obvious but this is quite important as it can drastically affect how much work we have to do. I'm not implying that I downloaded the map for New York Metro, but the starting format for this key.
The first part is that we need a vector based tube map, i.e. the PDF or even better an SVG version to start with. I tried both formats, in "normal" and large print. After popping them all into Adobe Illustrator, I clicked around to find the version which had the most amount of clean separation between layers. Turned out the PDF Large Print tube map was a reasonable starting point. I use that adjective loosely.
Spring cleaning
This is probably the most laborious part, but equally the most important to make this thing actually any use. Unfortunately with compressed PDFs, text fields are nearly always seperation in order to preserve the display of the typography as accurately as possible, making lines split into words, and words split into meaningless 1 or 2 letter "phrases". This is great for the human eye, but for actually 'querying' the document, it's useless as we need clean labels for each tube station.
Essentially the job was a manual one. I'm no Illustrator expert so there may well have been easier way, but it surpassed me if so. Here's a demonstration example of what I did:
Oxford Circus -> Oxford Circus
Do you see? To start with, we had 5 different (and meaningless) labels, "Ox", "for", "d C", "irc" and "us." Do you also see how I used the Tube line colours for my demo?
By now I'm sure you've figured out how I spent that evening...
Seperate the Tube lines
Now we have the station names cleaned up and ready for conversion (I'll explain how in a minute), it'd make it even more interactive if we could distinguish between the Tube lines themselves as well. Filtering just on the Central and Picadilly Lines, for example.
This part is a bit simpler and is actually a really simple technique of getting complex paths into Raphael JS.
I simply selected each line in Illustrator, and copied into a new standalone document. I then Saved a Copy, selected SVG 1.1 as the document format and clicked Show SVG Code. I was presented with this little beauty for the Central Line:
<?xml version="1.0" encoding="utf-8"?>
<!-- Generator: Adobe Illustrator 13.0.0, SVG Export Plug-In . SVG Version: 6.00 Build 14948)  -->
<!DOCTYPE svg PUBLIC "-//W3C//DTD SVG 1.1//EN" "http://www.w3.org/Graphics/SVG/1.1/DTD/svg11.dtd">
<svg version="1.1" id="Layer_1" xmlns="http://www.w3.org/2000/svg" xmlns:xlink="http://www.w3.org/1999/xlink" x="0px" y="0px"
width="400px" height="400px" viewBox="0 0 400 400" enable-background="new 0 0 400 400" xml:space="preserve">
<path fill="none" stroke="#ED3024" stroke-width="6.65" stroke-linejoin="round" stroke-miterlimit="3.994" d="M973.98,129.223
H773.97c-4.87,0-11.67,2.823-15.12,6.269L629.99,264.364c-3.45,3.44-10.25,6.258-15.12,6.258h-79.49
c-4.87,0-11.66-2.817-15.11-6.258l-33.239-33.236c-3.44-3.448-10.24-6.264-15.11-6.264H-572.959"/>
</svg>
I've highlighted the bit we need. This can then be used as simply as:
var c = paper.path("<<< PATH CONTENTS HERE >>>");
...and so on for each line.
Getting the stations into Raphael JS
This is the final stage really. Unfortunately there's no such easy technique for getting text labels into Raphael type code. After a bit of playing around, I wrote a PHP script to help me with this.
All you need to do as save the stations, and the stations only into a document. This does mean a lot of copying and pasting, or a lot of deleting of tube lines and artifcats, whichever your preference. However, with this done you should just have a document with a bunch of text labels which you save as an SVG 1.1 file somewhere.
Running this PHP script on it will loop through every SVG text node, extract the text and the x and y coordinates for you; making it super easy to plot all the hundreds of stations exactly where they were in SVG, using Raphael.
header("Content Type: text/plain");
$xml = simplexml_load_file("stations.svg");

foreach($xml->children() as $child) {
	if ($child->getName() == "text") {
		$matrix = $child->attributes();
		$matrix = str_replace(array("matrix(1 0 0 1 ", ")"), "", $matrix);
		$matrix = explode(" ", $matrix);

		// here we go
		$stationName = trim(str_replace(array("%%", '’'), array('\n', "'"), $child), " ");
		$x = $matrix[0];
		$y = $matrix[1];

		// your business logic here
                // echo($stationName);
} }
One last thing to note is that it seems line breaks (which are essential to mirror the layout of the Tube Map) are converted into seperate text fields when saving down to SVG. For this reason, and its not the cleanest solution I admit, I tokenised the strings with "%%" to represent a line break, which were then converted into line breaks using the code above.
Using that script I printed out the exact Javascript variables I needed for the project I was working on for this at the time, looped through them all and created them as text fields:
var stations = { "Oxford Circus" : { x: 100, y: 100 } };
for (p in stations) {
	var station = stations[p];
	var t = paper.text(station.x, station.y, p);
	t.attr({font: 'Arial', 'font-size': 13.5, fill: '#1C3F94'});
}
SVG and Illustrator file references
As a farewell I will leave you with the 2 SVG files which took the most time to produce and will do most of the work for you. I'm sure they could be cleaned up even further, and I'm open to any suggestions on how to do so.
SVG Source for Tube Stations SVG Source for Tube Lines
All should be labelled clearly for ease of use. Good luck!